
An email arrives from the land surveyor with a KMZ of the paddocks. The local council sends a zip with the plots of the industrial estate: five files with the same name and extensions that nobody recognises. A colleague shares yesterday's inspection route in GPX. And there is the client spreadsheet with two columns, latitude and longitude, that someone filled in by hand years ago. All of those are maps. And in most companies, nobody can open them without installing a desktop program, asking the technician for help, or waiting until Monday.
From today, in NAiOS, you can open them by dragging them. The module is called GIS, it is included in all plans and was born, as we explain below, from a Friday support ticket.
A project is a folder of maps
A GIS project is a folder of layers. Every file you upload becomes a layer: the module reads it, converts it to standard coordinates (latitude and longitude), and opens a summary sheet showing how many elements it has, whether they are zones, points or routes, what area it covers, what projection it came in, and what columns it contains. The original is saved and can always be downloaded.
What goes in:
- Shapefile zip, the format of desktop GIS and public administrations: SIGPAC, Catastro, municipal boundaries. A zip with several shapefiles yields several layers.
- KML and KMZ, what Google Earth exports and what circulates most in the field.
- GPX, routes, tracks and points from any GPS or sports watch.
- GeoJSON, the format of maps on the web.
- CSV or Excel with coordinates: the module recognises the latitude and longitude columns; if they are in UTM, you indicate it when uploading.

The projection, which is where half of the maps circulating by email break, is detected automatically: ETRS89 and ED50 in their UTM zones for Spain, Web Mercator, UTMs from all over the world and, because we work with Argentine cattle ranchers, the Gauss-Krüger of POSGAR 2007, POSGAR 94 and Campo Inchauspe. If the file does not say which projection it is in, the summary sheet warns you instead of drawing the layer in the middle of the ocean.
The first thing everyone asks: how many hectares
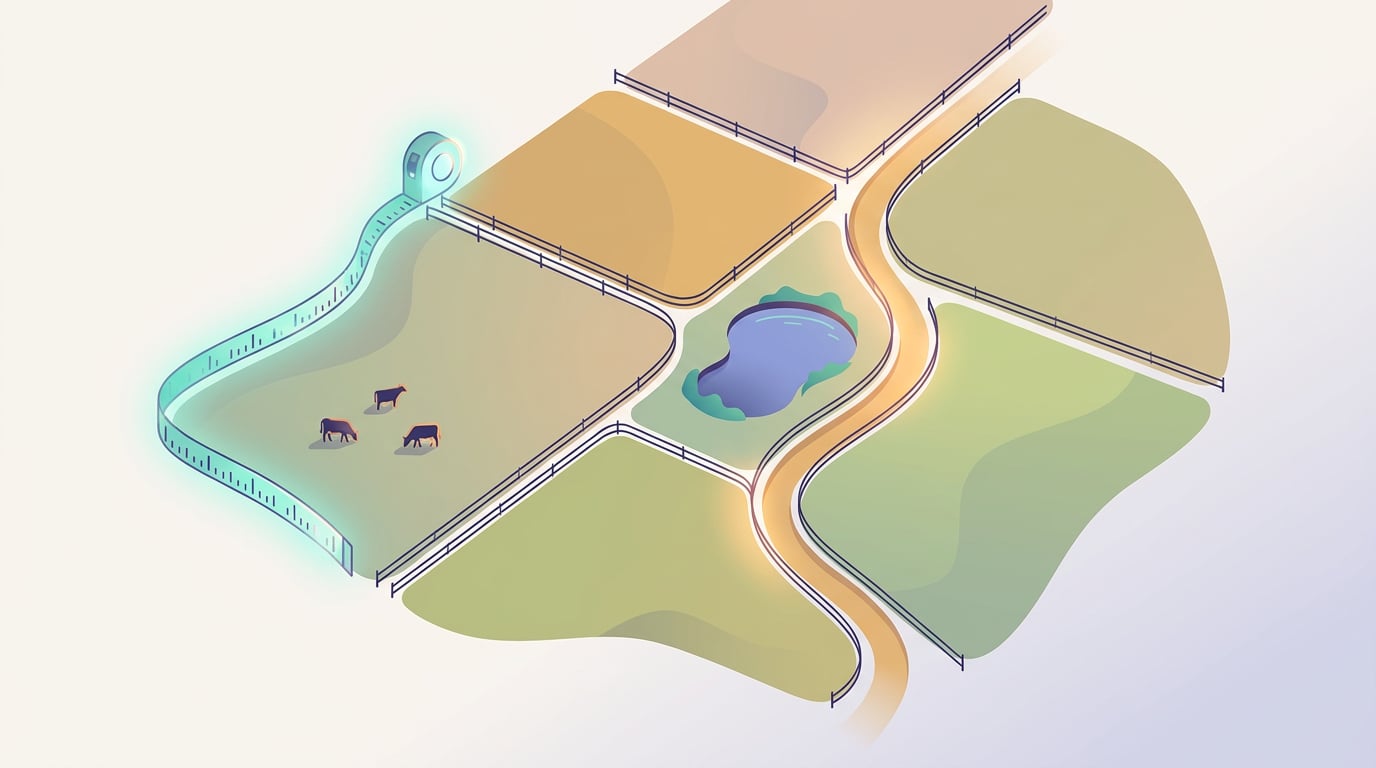
When importing a layer of zones, GIS calculates the area of each one in hectares and the total for the layer. For routes, the length in kilometres. These are the first columns of the table, sorted with a click and shown on the summary sheet. For a paddock, a plot or a route, it is the data that governs everything else, and until now it required another program and another person.
A map for non-technical people
When we showed the first version, the criticism came in two words: "muy tech". The person receiving these files is not a cartographer. So the screen speaks in the person's language, not the file's.
- Layers are called "Plots" or "Clients", not the name of the file they came from. The summary says "177 zones · 14,758 ha", not the name of the geometry type.
- The table shows the six most useful columns by default, with the one that looks like the name first, and a button to see the rest. Search, sort, and click on the row to go to the element on the map.
- Clicking on the map opens the element's card: its name as the title, the main data, "Centre here" and "Open in Google Maps".
- Each layer can be downloaded in GeoJSON, CSV or Excel. And if you want to see it working before uploading anything, "Try with an example" creates a project with countries, clients and a route.
Everything technical is still there, behind "More options". No capability is removed: it is hidden until needed.
And in 3D
In the corner of the map, there is a 2D / 3D switch. When clicked, the same layers, without uploading anything again, rest on the real terrain: mountains with their height and shadow, which you tilt and rotate with the right mouse button or two fingers. Three backgrounds to choose from: map, satellite image or aerial photo of Spain, from the PNOA of Spain's National Geographic Institute.
And one thing that turns any table into a thematic map in two clicks: "Show as bars". You choose a layer of zones and a numerical data point—head of cattle, sales, inhabitants, floors of a building—and each zone rises in proportion. The height adjusts automatically so that the maximum looks good; anyone who wants the fine slider can find it in "More options".

The satellite images are from Sentinel-2 and are designed for internal use; the panel points this out with a discreet line. If a platform needs them turned off, the administrator can do so in the module settings, and the map and aerial photo will keep working.
From the chat
This is the part that resolved the ticket. If you have GIS active, attach the zip, KMZ or GPX in the chat just as you would attach a PDF. The file is imported as a layer in a project called "From the chat" and the model receives the summary sheet: how many elements, which columns, the first rows and the link to the project. From there, you ask it what you would ask a colleague: how many plots there are, which is the largest, which municipalities appear.
It is the same idea that runs through the entire platform and that we explained in NAiOS, explained today: the chat does not replace the modules, it opens them. Documents go to the Knowledge Base, invoices to the ERP and, from today, maps to GIS.
How it was done: from a ticket to all platforms in a day
On Friday afternoon, a user of one of the platforms we manage attached a .shp file to the chat and the chat rejected it. They opened a ticket in Support. The easy answer was to add the extension to a list. The correct one was different: a shapefile is four or five files that travel together, and "analysing a map" is not reading text, it is seeing a map, a table and knowing what projection it is in. That is a module.
At eleven o'clock at night, there was a proof of concept with the countries of the world. At midnight, the plan in writing. At eight o'clock on Saturday morning, the module with map, table, export, hectares, Argentine projections, 3D view and the plain language review already done. By two o'clock in the afternoon, it was on all platforms and the user had their answer in the ticket. It was built by NAiOS Labs, the same development agent we talked about in the post on Skills, with a person approving every step and deciding the scope: with input from the chat, for all plans, with a free background map.
We are not sharing this to boast about speed, but because it says something about the product: when the chat and the modules share the same foundation, what is missing is built on what is already there, and one person's ticket can become a feature for everyone.
What it doesn't do, yet
GIS does not cross layers: it does not tell you which clients fall within which zone, nor the distance from each paddock to water, nor does it intersect plots. Projects belong to whoever creates them and are not yet shared with the team. There is no satellite pasture index or elevation profile of a route. All of that is in the plan, in that order, and we will talk about it when it is ready, not before. The "What you can do" tab of each project lists what is available and what is coming.
Where to start
Log in to your NAiOS platform, open GIS in the modules menu and click "Try with an example". Then drag the last map you were sent and could never open. If anything fails, open a ticket: that is how this module started.